 The moonwalk makes it appear that a person is heading forward while actually moving backwards.
Now that Michael Jackson sadly is no longer with us, his phenomenal mastery and performance of the moonwalk has been replaced by the U.S. economy.
We all hear the loud trumpeting by the usual suspects and the President himself about how the economy is recovering and how we’re heading for a brighter future.
But . . .
Since 1970, the annual earnings of the median prime-aged male have fallen by 28%.
Since 2008, the population of the U.S. has increased by 16,800,000 people, but the total number of full-time jobs has decreased by 140,000.
Since 2009, the number of Americans who are not a part of the work force has increased from 80.5 to 92.9 million.
With 62.7% of the population constituting the nation’s labor force February of this year, we are looking at the lowest level of participation in the job market since March 1978.
The U.S. Census Bureau reports: “In 2013, real median household income was 8.0% lower than 2007.” Moreover, this was 8.7% lower than in its peak year, 1999.
Since 1973, the number of people in the U.S. living in poverty has doubled, going from 23 million to over 46 million.
Since 1970, the percentage of prime age men in the work force has declined from 94% to 81%, an alarming drop which runs counter to demographic expectations. It’s not just old folks retiring. It’s young people unable to find work.
While the total wealth of the nation continues to make impressive gains, the median American household saw its total assets fall by 36% since 2003.
From over 13% in the early 70s, the savings rate for Americans recently has plunged to around 4%. There’s simply not much left to put away these days, after expenses eat up wages that effectively have been flat since 1995.
Income earned from working a full-time minimum-wage job __ adjusted for inflation to equate to 2014 dollars __ declined from $22,000 in 1968 to its current level of less than $15,000 per year.
Income inequality has become the hot new topic. The U.S. was once considered a model throughout the world for fairness and the equitable distribution of its enormous wealth. That is becoming a distant memory.
Between 1979 and 2007, while for the top 1% cumulative change in real capital income increased to 309.3%, for the middle class it actually decreased to -17.3%.
While in 1976, the richest 1% only took home about 9% of the enormous wealth generated by our country, by 2012 they were hauling in 24% of the nation’s annual earnings.
According to the analysis of economists Emmanuel Saez and Gabriel Zucman writing at the London School of Economics, 160,000 families in America now own as much wealth as the nation’s poorest 145 million families.
While the vast majority of Americans have not recovered from the devastation of their savings, the drop in value of their homes (if they still have a home), and whatever else they lost in the crash of 2008, the rich did quite well. 95% of the gains that have accrued in the gradual economic rebound over the past several years have gone to the wealthiest 1%.
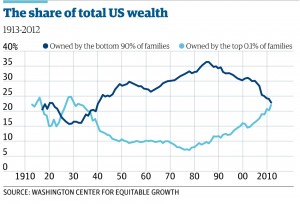
 In the mid-80s, there still existed a thriving middle class. The bottom 90% of Americans claimed ownership of over 36% of the national wealth. That has fallen to 23% and now the top .1% owns as much as that bottom 90%.
As $30 trillion of new wealth was being generated between 2007 and 2014, and the 115,000 households which comprise the wealthiest .1% were increasing their annual earnings by an average of $10 million per year, the number of children on food stamps grew from 9.5 to 16 million __ a surge of almost 70% __ and as they counted their pocket change on any given frigid night in January . . . 138,000 of those kids were homeless.
There are those who seem to think that somehow this represents progress.
Moonwalk anyone?


